JAPANESE CANDLESTICK CHART PATTERNS
There are 12 major Candlestick patterns that have probabilities of indicating correct future direction of a price move.
The following signals occur in price movements often enough to be beneficial in producing a ready supply of profitable trades as well as clearly indicating price reversals with strength enough to warrant placing trades. They are the signals that investors should contribute most of their time and effort.
1. Doji

A Doji is formed when the open and the close are the same or very close. The length of the shadows are not important. The Japanese interpretation is that the bulls and the bears are conflicting. The appearance of a Doji should alert the investor of major indecision.

A Doji is formed when the open and the close are the same or very close. The length of the shadows are not important. The Japanese interpretation is that the bulls and the bears are conflicting. The appearance of a Doji should alert the investor of major indecision.
Recognition: The open and close are the same or very close to the same.
Pattern Psychology: The Bulls and the Bears are conflicting. This is an alert to investors to take heed for possible trend reversal.

The Gravestone Doji is formed when the open and the close occur at the low of the day. It is found occasionally at market bottoms, but it’s forte is calling market tops. The name, Gravestone Doji, is derived by the formation of the signal looking like a gravestone.

The Long-legged Doji has one or two very long shadows. Long-legged Doji’s are often signs of market tops. If the open and the close are in the center of the session’s trading range, the signal is referred to as a Rickshaw Man. . The Japanese believe these signals to mean that the trend has “lost it’s sense of direction.”
2. Bullish Engulfing Pattern

The Bullish Engulfing Pattern is formed at the end of a downtrend. A white body is formed that opens lower and closes higher than the black candle open and close from the previous day. This complete engulfing of the previous day’s body represents overwhelming buying pressure dissipating the selling pressure.
Recognition: The body of the second day completely engulfs the body of the first day. Shadows are not a consideration.
Pattern Psychology: This pattern suggests the Bulls are stepping in with force, suggesting prices will move up.
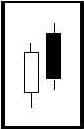
3. Bearish Engulfing Pattern

The Bearish Engulfing Pattern is directly opposite to the bullish pattern. It is created at the end of an up-trending market. The black real body completely engulfs the previous day’s white body. This shows that the bears are now overwhelming the bulls.
Recognition: The body of the second day completely engulfs the body of the first day. Shadows are not a consideration.
Pattern Psychology: This shows the Bears are overwhelming the Bulls, suggesting prices will move down.
 4. Dark Cloud Cover
 The Dark Cloud Cover is a two-day bearish pattern found at the end of an upturn or at the top of a congested trading area. The first day of the pattern is a strong white real body. The second day price opens higher than any of the previous day's trading range.
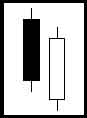 5.Piercing Pattern
 The Piercing Pattern is a bottom reversal. It is a two candle pattern at the end of a declining market. The first day real body is black. The second day is a long white body. The white day opens sharply lower, under the trading range of the previous day. The price comes up to where it closes above the 50% level of the black body.
Recognition: A two candle pattern, the body of the first candle is black and the body of the second candle is white. The white day opens lower, under the trading range of the previous day. The price closes above the 50% level of the black body.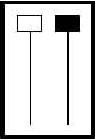
7. Morning Star
 The Morning Star is a bottom reversal signal. Like the morning star, the planet Mercury, it foretells the sunrise, or the rising prices. The pattern consists of a three day signal.
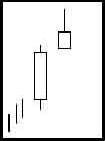
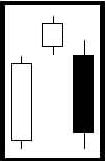 8. Evening Star
 9. Shooting Star

Recognition: A two candle pattern, the body of the first candle is white and the body of the second candle is black. The black day opens higher, above the trading range of the previous day. The price closes below the 50% level of the white body.
Pattern Psychology: After a strong uptrend, the atmosphere is Bullish but before the end of the day the Bears step in and price closes near the low of the day.

Recognition: A two candle pattern, the body of the first candle is black and the body of the second candle is white. The white day opens lower, under the trading range of the previous day. The price closes above the 50% level of the black body.
Pattern Psychology: After a strong downtrend, the atmosphere is Bearish but before the end of the day the Bulls step in and price closes near the high of the day.
6. Hammer & Hanging-man
 Hammer and Hanging-man are candlesticks with long lower shadows and small real bodies. The bodies are at the top of the trading session. This pattern at the bottom of the down-trend is called a Hammer. It is hammering out a base. The Japanese word is takuri, meaning ?rying to gauge the depth

Recognition: The lower shadow (or tail) should be at least two times the length of the body. The color of the body is not important although a black body has slightly more Bearish indications and a white body has slightly more Bullish indications.
Pattern Psychology: This pattern at the bottom of a down trend is called a Hammer. This pattern at the top of an uptrend is called a Hanging-Man
7. Morning Star

Recognition: A three candle pattern at the bottom of a downtrend.The body of the first candle is black, confirming the current downtrend. The second candle is an indecisive formation. The third candle is white and should close at least halfway up the black candle.
Pattern Psychology: After an apparant downtrend the Bulls step in and open the price higher than the previous day's close. The price finishes higher for the day and the Bears are concerned and begin covering their short positions.
The Evening Star is the exact opposite of the morning star. The evening star, the planet Venus, occurs just before the darkness sets in. The evening star is found at the end of the uptrend.
Recognition: A three candle pattern at the top of an uptrend. The body of the first candle is white, confirming the current uptrend. The second candle is an indecisive formation. The third candle is black and should close at least halfway down the white candle.
Pattern Psychology: After an apparant uptrend the Bears step in and open the price lower than the previous day's open. The price finishes lower for the day and the Bulls are concerned and begin selling to take their profits.
A Shooting Star sends a warning that the top is near. It got its name by looking like a shooting star.
The Shooting Star Formation, at the bottom of a trend, is a bullish signal. It is known as an inverted hammer. It is important to wait for the bullish verification. Now that we have seen some of the basic signals, let? take a look at the added power of some of the other formations.
 Kicker Signals
Bearish and Bullish
Recognition: One candle pattern appearing in an uptrend. The shadow (or tail) should be at least two times the length of the body. The color of the body is not important, although a black body has slightly more Bearish indications.
Pattern Psychology: After a strong uptrend the Bulls appear to still be in control with price opening higher, but by the end of the day the Bears step in and take the price back down to the lower end of the trading range. Lower trading the next day reinforces the probability of a pullback.
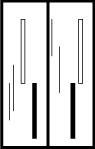
10. Kicker Signals
Bearish and Bullish
Recognition: The first day's open and the second day's open are the same BUT the price movement is in opposite directions.
Pattern Psychology: The Kicker Signal demonstrates a dramatic change in investor sentiment. The longer the candles, the more dramatic the price reversal.
More to come !